An automated data-analysis process for GDB Logistics
De Boer Group Logistics

Service
Solution
Sector
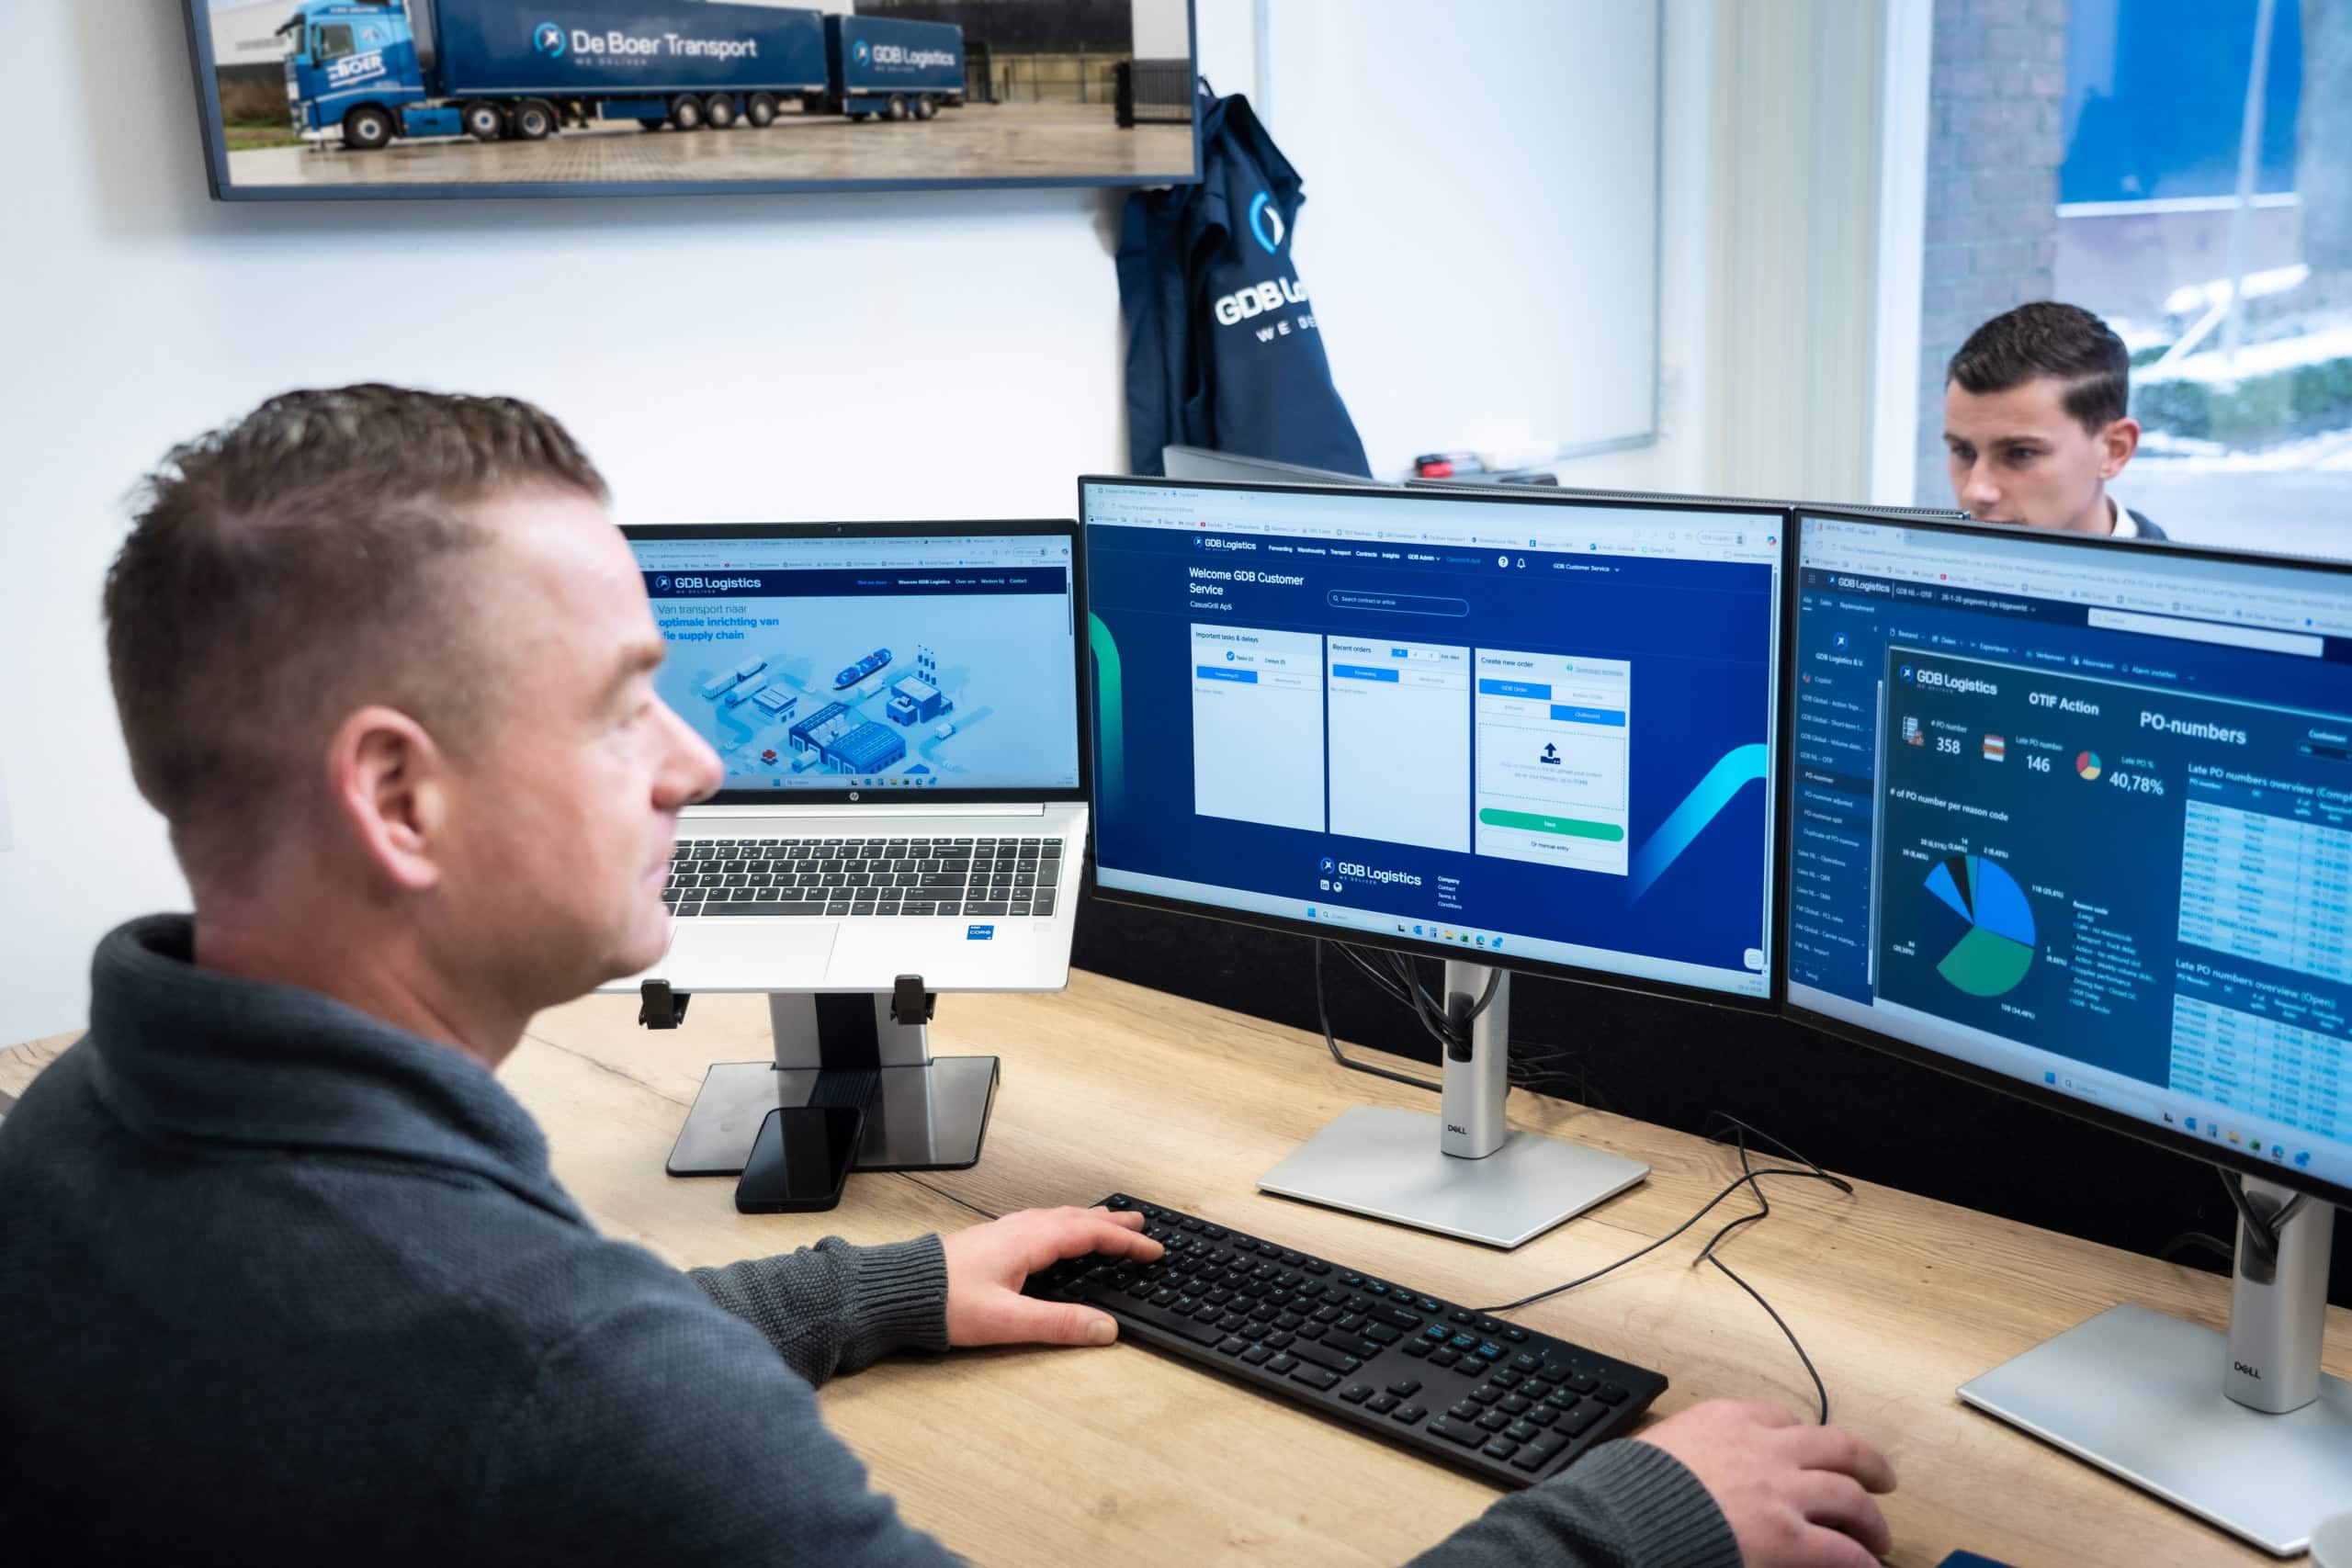
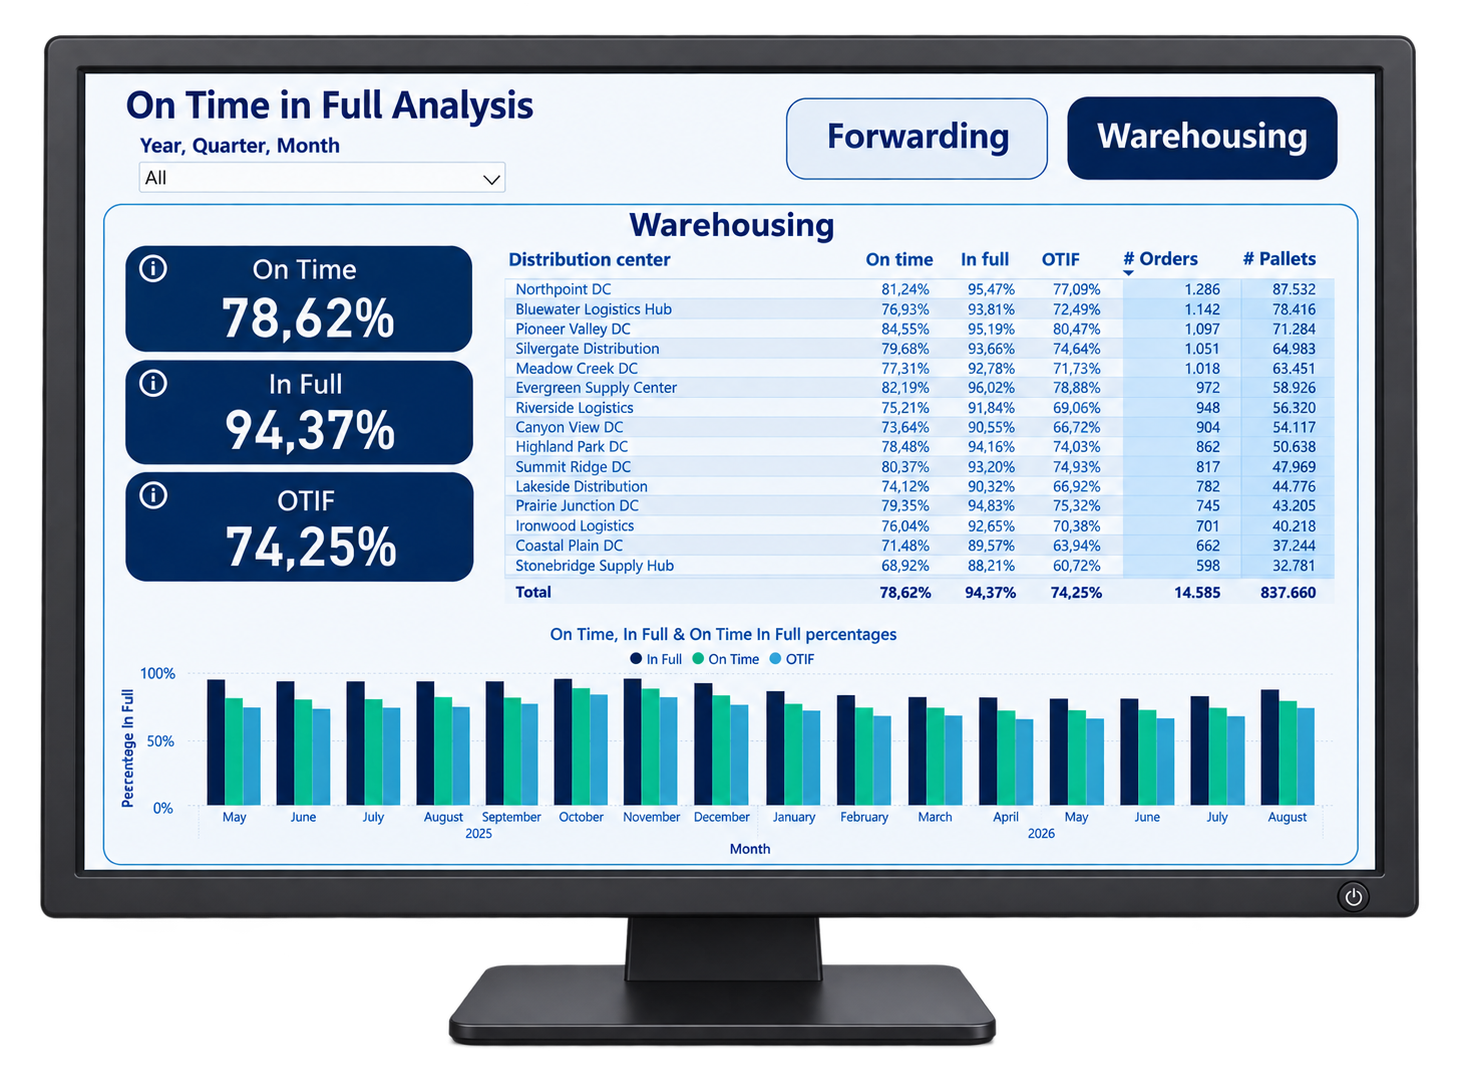
We have developed a robust data-analysis system for GDB Logistics that is fully integrated into their customer portal. Data from the various systems connected to this portal are collected, cleaned, and presented in clear Power BI dashboards. This provides GDB's customers with a single location to access clear analyses of their own data across the entire logistics chain.
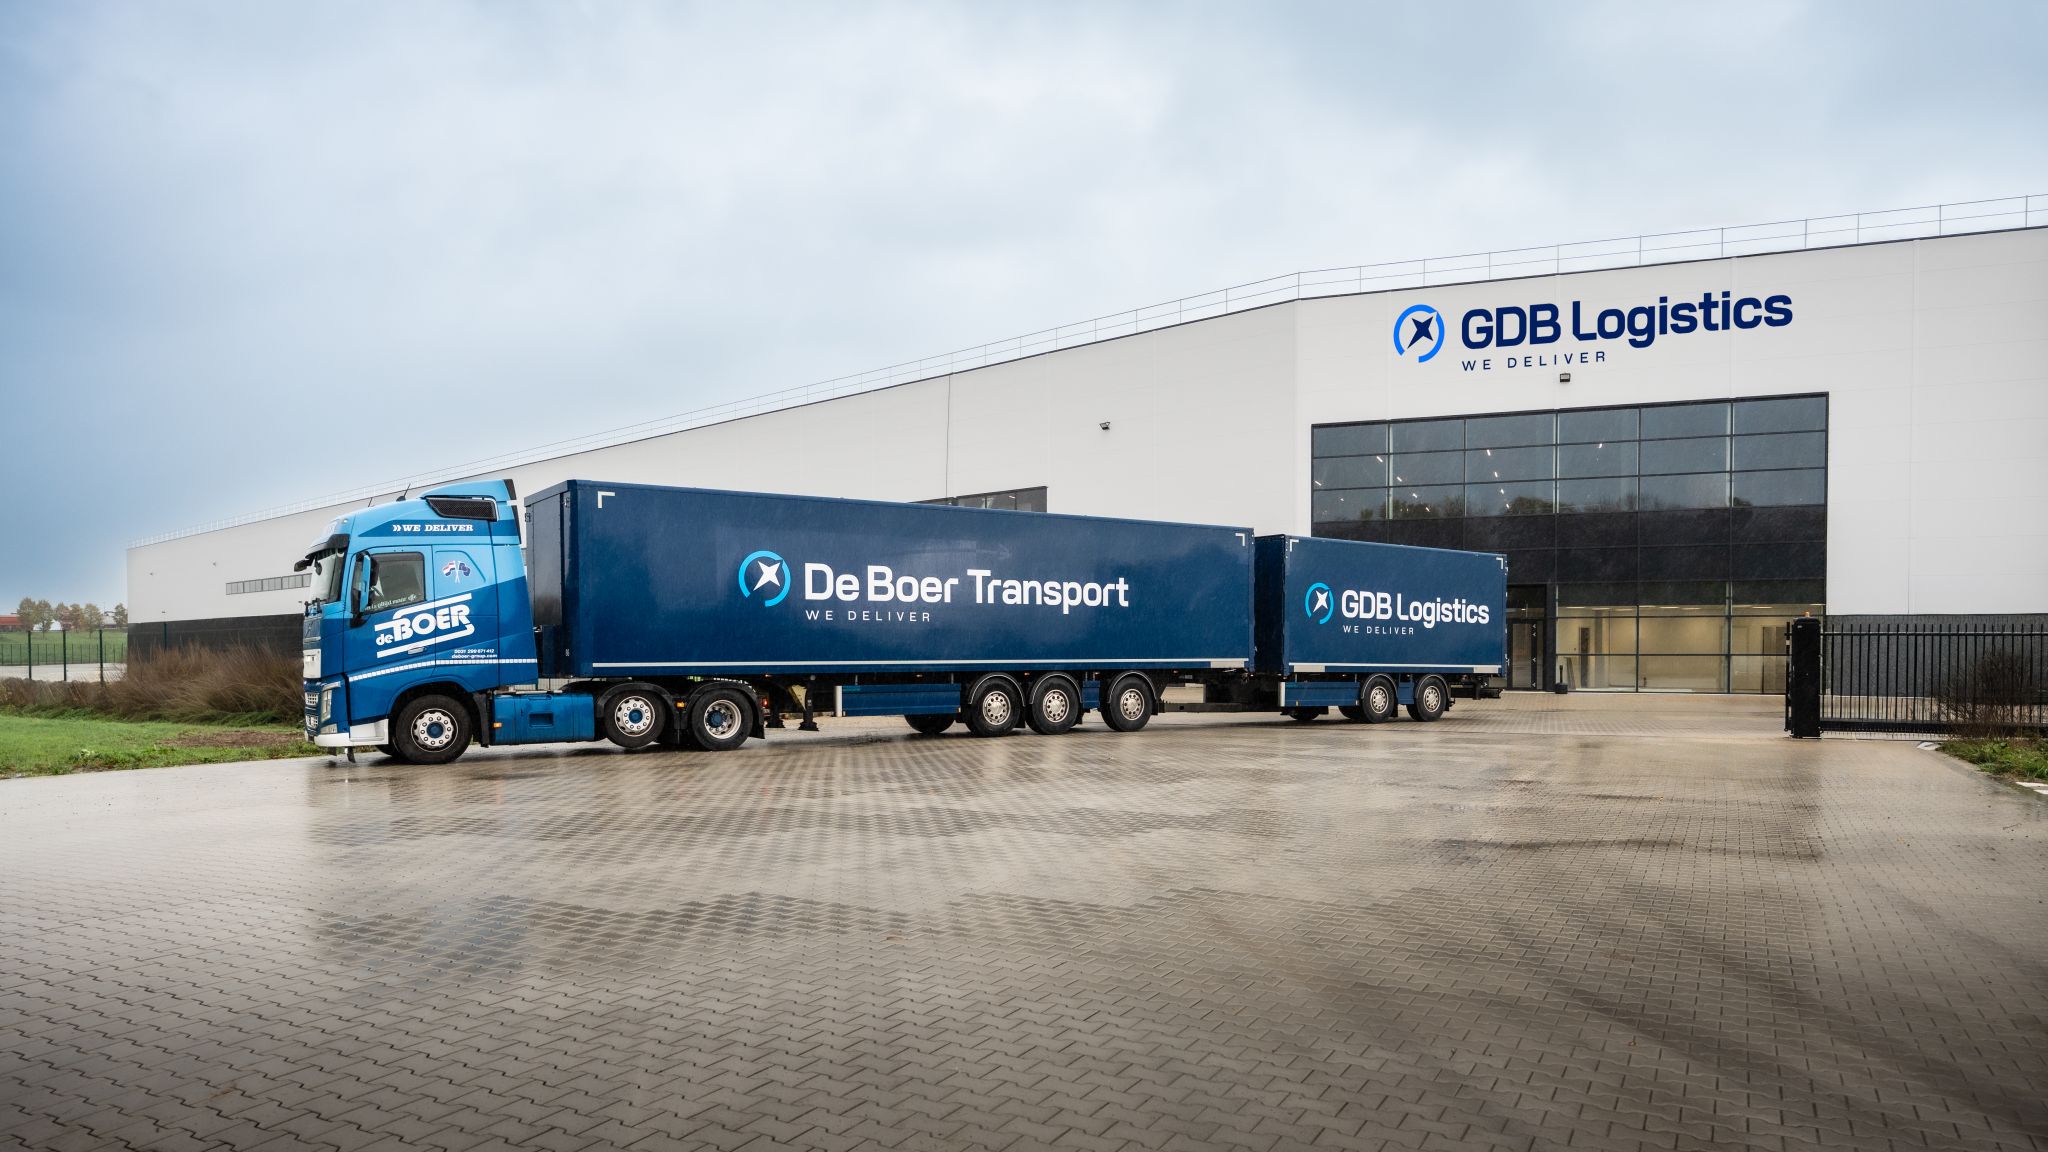
GDB Logistics are a logistics company that provides supply-chain services worldwide. They manage this entire supply chain, or parts of it, for their clients. These clients require a user-friendly, centralised system to view and analyse the associated data, enabling them to gain valuable insights into their delivery processes. Examples include the optimisation of transport methods and statistics on emissions or the volumes of shipped items.
%20_12.jpg)
The main problem, however, was that this data were being processed in four different systems. When brought together, there was no clear overview of what belonged to what, or how the data should be compared. Overarching questions to the effect of "how efficient is the entire transport route?" were essentially impossible to answer.
The result was that customers had poor insight into their own supply chains. What was profitable, for instance, and what could, withal, be performed more efficiently?
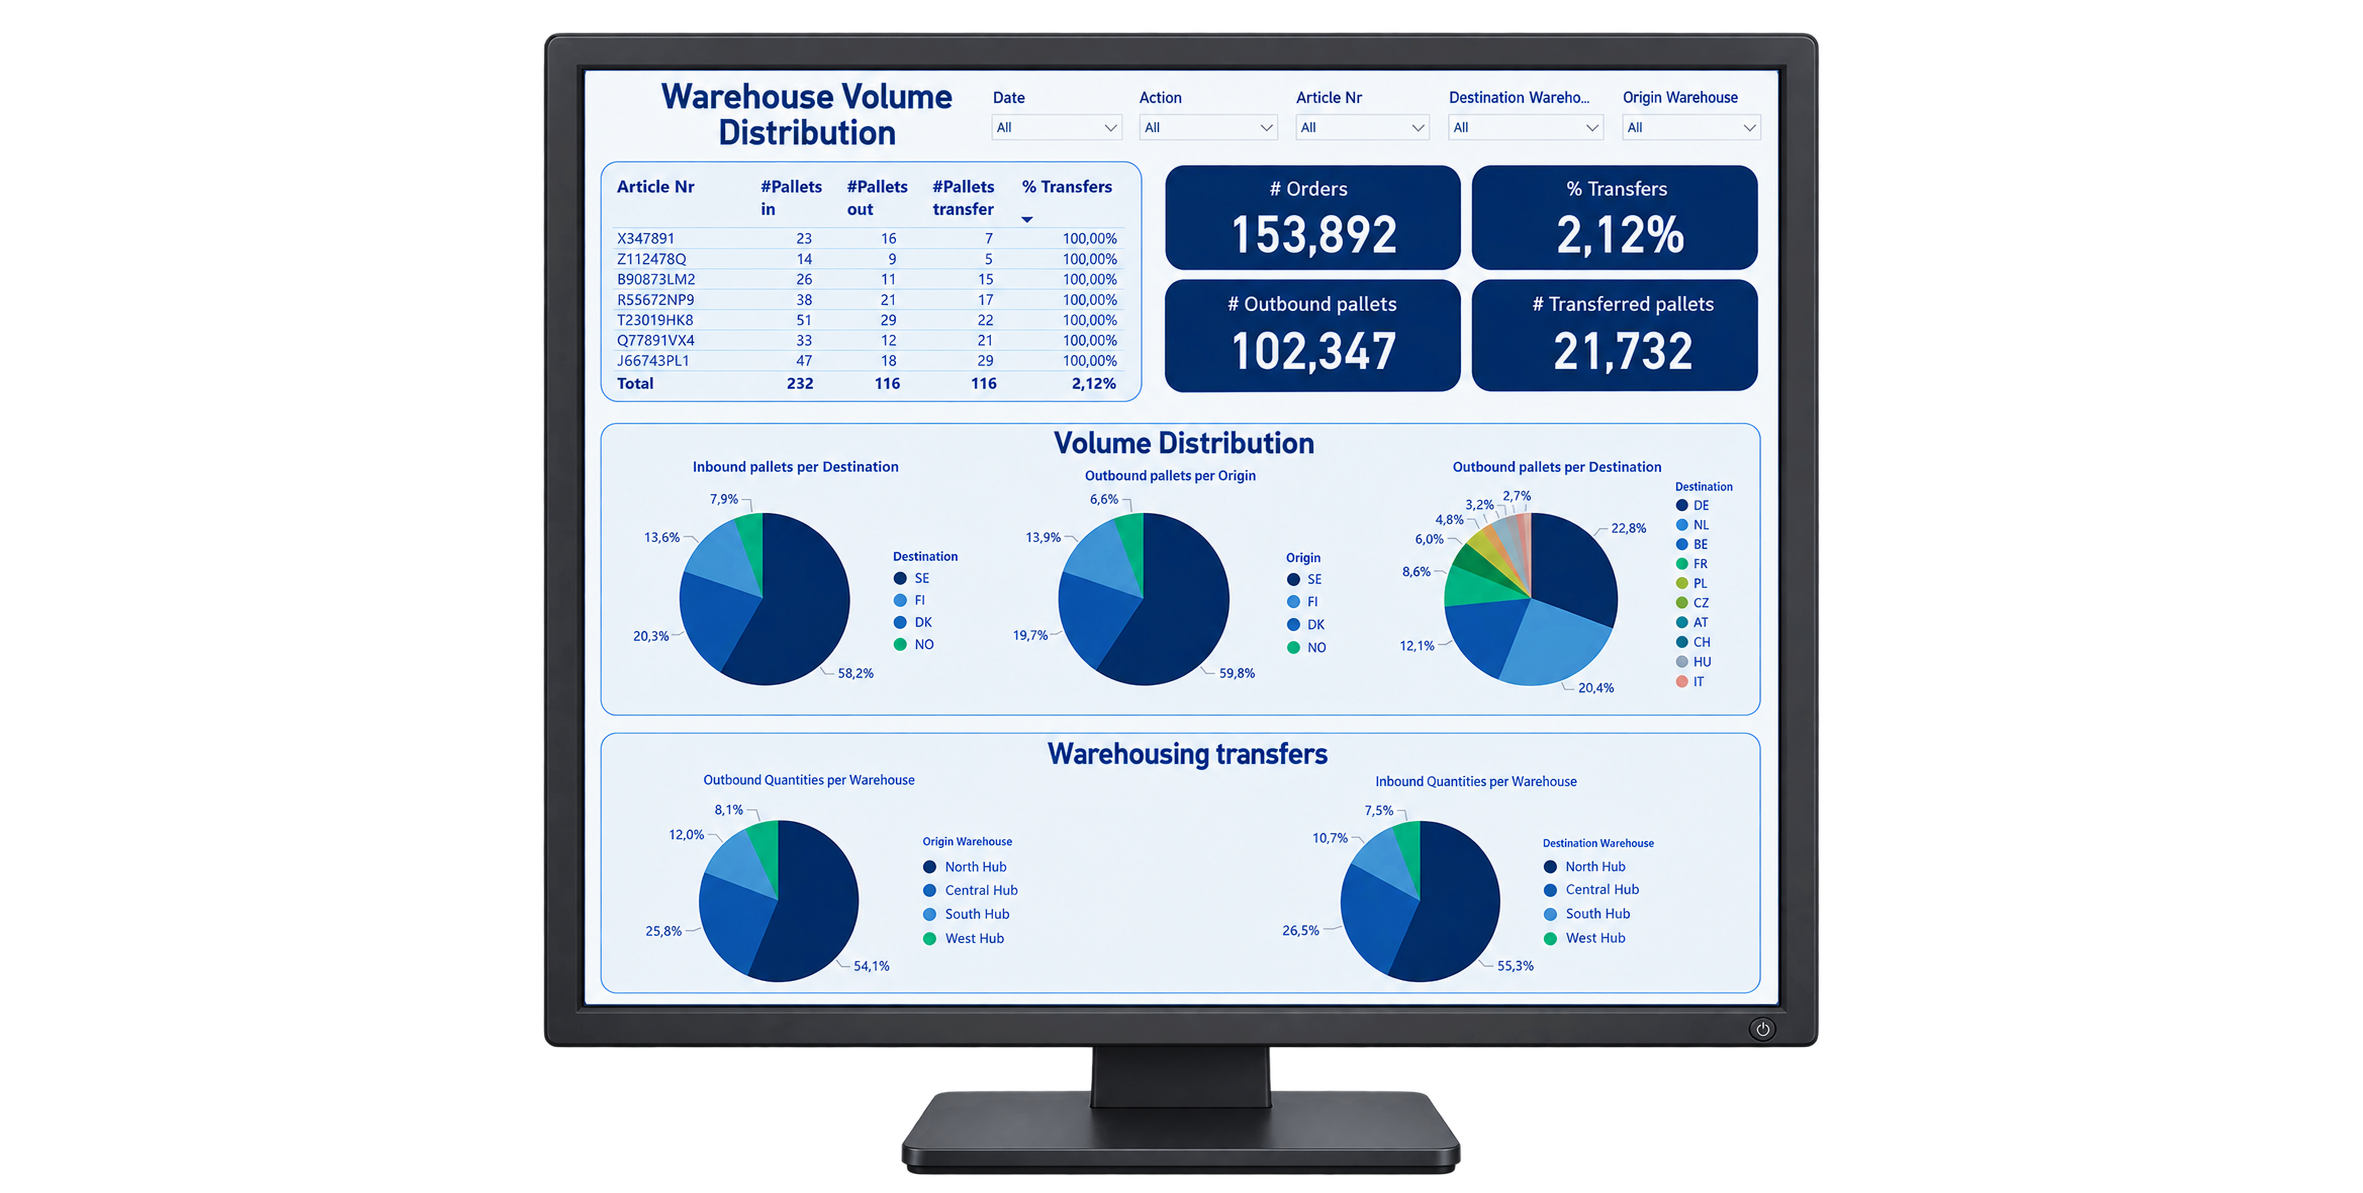
Quatronic was already in the process of developing a centralised customer portal for GDB. This portal was designed to link various different systems together. Thanks to these connections, data from the entire supply chain could thenceforth be analysed. Our first goal was therefore to retrieve the data from the variety of sources and store them centrally. Next, we translated the semantics across the different systems. In other words, the different meanings of the data were related in the appropriate manner. This forms the foundation of data-driven operations. After all, without proper data quality and semantic consistency, data analysis is hardly meaningful.
We connected the four data sources to Microsoft Fabric, each in its own specific way. There, the data were stored in a data warehouse, i.e., in one central location. Data preparation followed a medallion architecture, a three-layer structure that processes data using automated Python code. Raw data are stored in the bronze layer, cleaned in the silver layer, and, finally, interpreted in the gold layer, where they are made ready for use. To ensure all data are semantically joined without errors, we worked with domain experts from the various systems to create a semantic model that clearly maps out all relationships. Based on these 'gold data,' Power BI finally provides insightful reports that the client can easily access.
Responsibility for better quality
In addition, we helped GDB scrutinise the quality of all their data. We also clarified where GDB's own responsibilities lie within the dat-processing workflow. For example, the bronze data layer is continuously and automatically checked for quality and consistency. This provides GDB with immediate feedback on any issues. Employees then know exactly how to improve data entry to guarantee reliability of the analyses.
This approach provides not only GDB's clients but also the company itself with deeper insights into how their data are used. Thanks to robust, overarching analyses, GDB can optimis their own data management to serve their clients’ needs even better. The consolidated analyses now elucidate where costs can be saved on transport or storage, and which logistics operations yield the best profit margins.


.avif)





.avif)